
How to Debug Your Process with Time in Status for Jira
A practical walkthrough of the Time In Status - Custom Field, Sprint Report, and AI-powered analysis — from install to first insight.
You installed Time in Status. Or you're about to. Either way, you're wondering: what do I actually do with this?
Time in Status isn't time tracking. Time tracking logs hours for invoicing. Time in Status tracks where work gets stuck in your process — which stages take too long and what's slowing delivery.
It surfaces the right information at the right moment — on the board during standup, on the issue while you're working, and across the sprint when you're preparing for the retro.
This walkthrough covers the three layers of the tool and how they work together: seeing time on the board, understanding patterns in the sprint, and using AI to pinpoint what to fix.
Step 1: See It on the Board
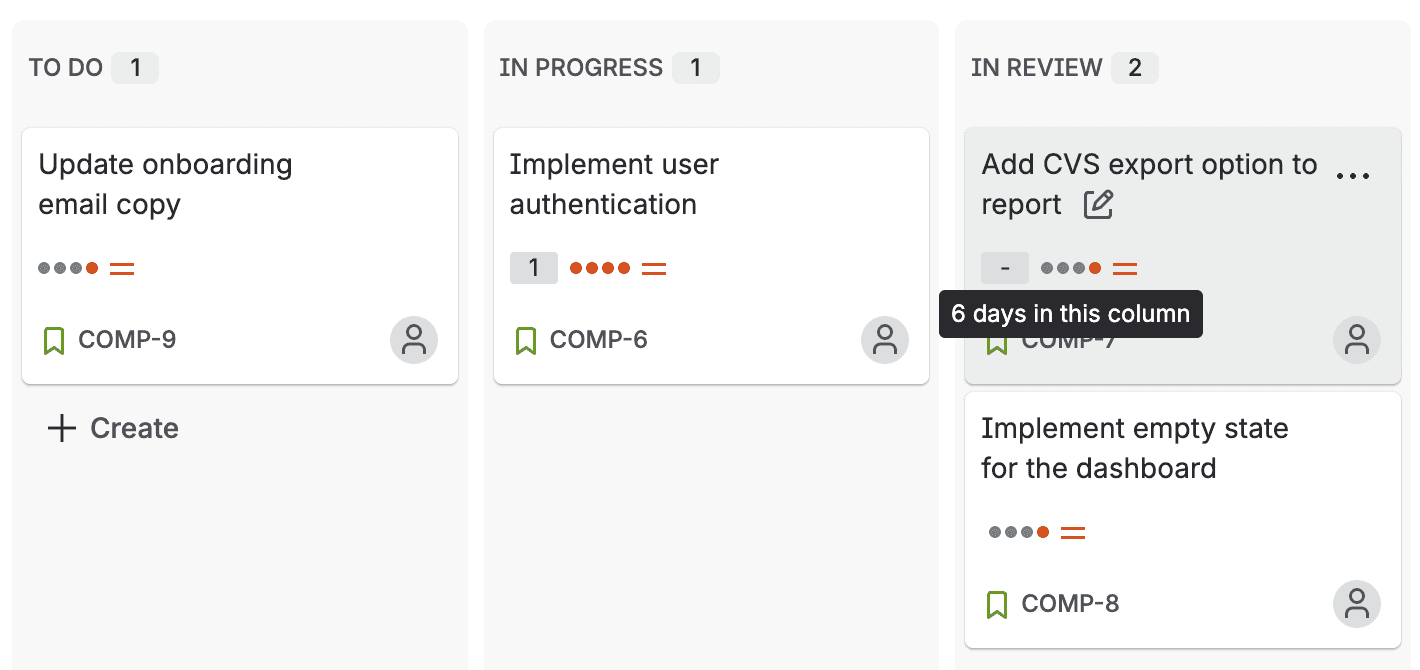
After you install and open, enable Jira's built-in Days in column to your board card layout. Once enabled, hover over any card to see how long it's been sitting in its current status — like "6 days in this column" for that card stuck in Review.
That number wasn't visible before. Now it is — and standup conversations change.
What to look for
Cards with high durations in wait states. "In Review" for 3 days? "Awaiting QA" for 2 days? These are issues where nobody is actively working, but the clock is still running. That's wait time — the silent killer of cycle time.
Cards that look fine but aren't. An issue in "In Progress" for 5 days might be normal for a complex feature. Or it might be blocked and nobody mentioned it. The duration makes it visible either way.
The pattern across columns. If your "In Review" column consistently shows higher durations than "In Progress," that's not a one-off. That's a process signal.
Step 2: Dig Into Any Issue
Click into any issue and open Time in status from the app actions menu. This is where you go from "something looks off" to "here's exactly what happened."
Focus Mode
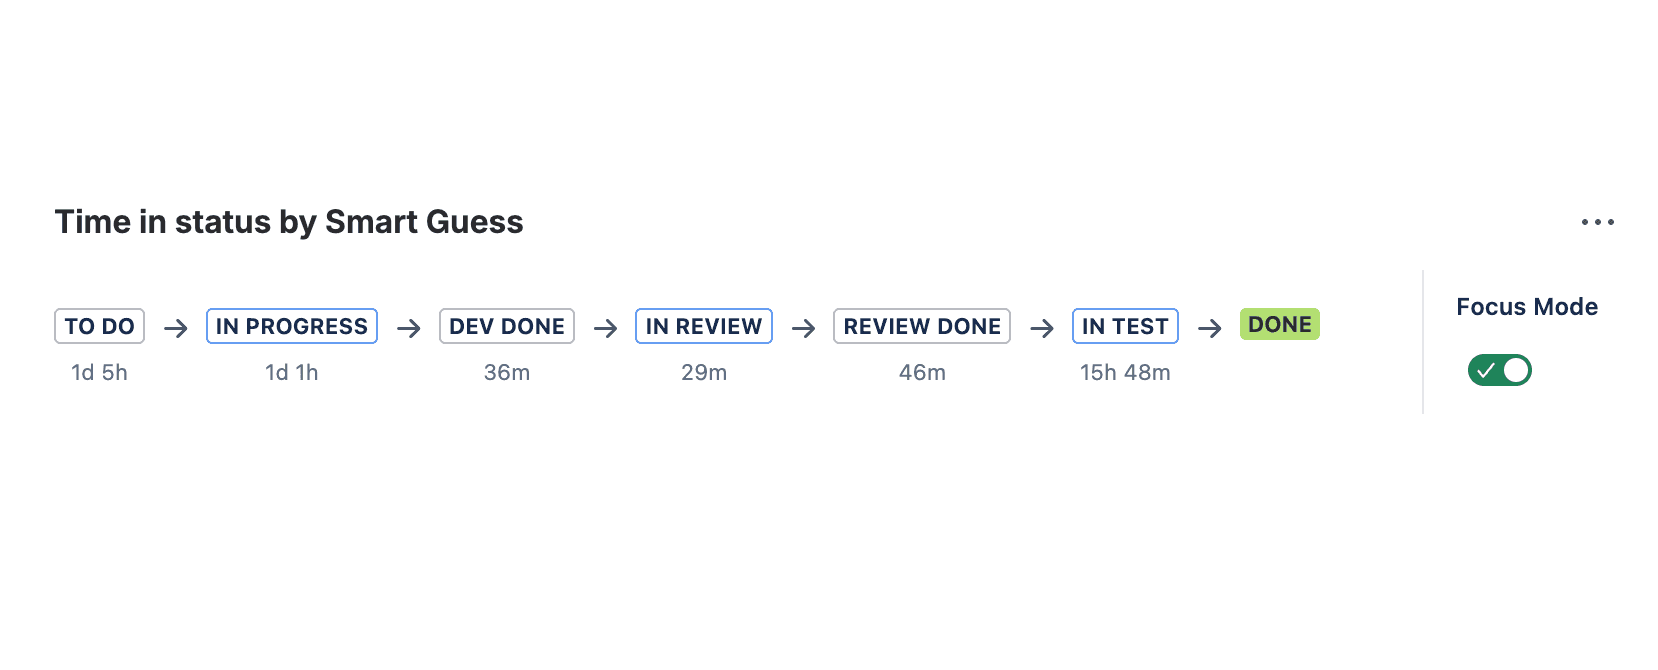
By default, Focus Mode is on — you see the Status Flow at a glance: every status the issue passed through, with durations at each step. This is enough to answer "where did the time go?" without leaving the issue.
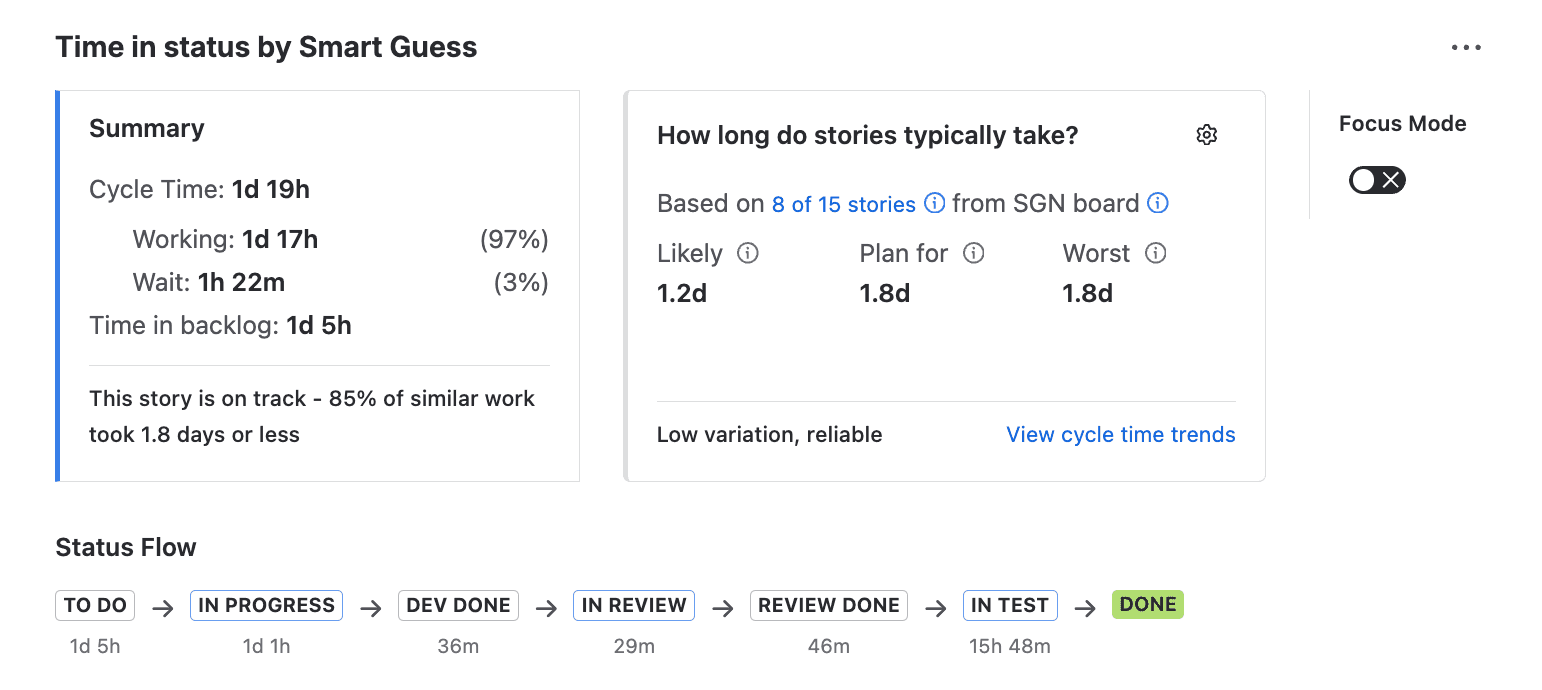
Turn Focus Mode off and you get the full picture: Summary card, Forecast card, Timeline, and links to team patterns. This is where you dig in.
The Status Flow
The Status Flow shows every transition the issue went through, with time spent in each status. TO DO → IN PROGRESS → DEV DONE → IN REVIEW → REVIEW DONE → IN TEST → DONE, with durations at every step.
This answers the question retrospectives always struggle with: where did the time actually go? Not where you think it went. Where the data says it went.
The Summary Card
The Summary Card compares this issue's cycle time against similar work. It breaks out working time vs. wait time and shows a health indicator — green, amber, or red — based on how this issue stacks up against the 85th percentile.
If the card border is orange, this issue is taking longer than 85% of comparable work. That's your signal to investigate — not after the sprint, right now.
The Forecast Card
The Forecast Card gives you three dates: likely, plan-for, and worst-case. These are based on historical data from similar issues, not gut feel.
When a stakeholder asks "when will this ship?" you don't need to hedge. You can point to the Forecast Card and give a data-backed range.

Step 3: See Where the Sprint Lost Time
The board card shows you the current status. The issue panel shows the exact process steps for one issue. The Time in Status tab gives you the 10,000-foot view of the sprint as a whole.
Open Flow Intelligence and navigate to the Report section, and the Time in Status tab. You'll see time in status broken down for every issue in the sprint, grouped by work type.
What the Time in Status tab tells you
Per-issue breakdown. Every issue in the sprint, with time spent in each status. You can quickly spot outliers — the one story that spent 4 days in review while everything else moved through in hours.
Working vs. waiting, color-coded. Every cell is tinted — yellow for waiting, blue for working — so you can scan the table and immediately see where time is piling up. If a column of yellow stretches across most issues, that's not one slow story — that's a systemic pattern.
Step 4: Let AI Identify Patterns and Brainstorm Next Steps
You've seen the data. You've spotted the patterns. Now what?
This is where most tools stop — and where most teams get stuck. You know review is slow, but why? Is it too few reviewers? Too-large PRs? Sprint overcommitment? The data alone doesn't tell you.
Noesis does.
Click "Ask Noesis" on any Time in Status report and it analyzes your sprint data across all work types — identifying where work gets stuck, which work types to investigate first, and why.
How the conversation works
Start broad:
"Analyze overall flow health across all work types. Where is work getting stuck?"
Noesis might tell you that bugs and security items flow smoothly (19h cycle time) while stories and tasks hemorrhage time in queues (5+ day lead times). The pattern: urgent reactive work starts immediately, displacing planned work that waits the entire sprint.
Then drill down:
"Analyze flow for Stories — what should we improve?"
Now you get specifics. Three stories waited 3–7 days before starting while two jumped the queue instantly. Once work starts, the team is efficient — but 66% of lead time is waiting time. The root cause isn't slow developers. It's sprint overcommitment and mid-sprint priority disruption.
What makes Noesis different
Noesis doesn't just describe the problem — it suggests specific experiments with measurable outcomes. Things like:
"Limit WIP in To Do — pull only 3 stories instead of 5. Measure: do stories that make the cut start within 1 day instead of 3–7?" Or: "Create an Urgent swim lane to make mid-sprint additions visible. Measure: how many planned stories get displaced each sprint?"
Let NoEsis do what AI does best — process the data, match patterns across issues, and draw on extensive knowledge of engineering best practices to suggest what to try next. You bring the context. Noesis brings the analysis. You lead the change.
Putting It Together: The Daily Workflow
Here's how these three layers work in practice:
During standup — You glance at the board. A card in Review shows "3d 2h." You ask: "Does anyone have capacity to pick up this review?" The blocker gets resolved that morning instead of lingering until next week.
When a stakeholder asks about a deadline — You open the issue, check the Forecast Card, and say: "Based on similar work, likely done by Thursday, plan for Friday." No hedging, no mental math.
Preparing for the retro — You pull up the Time in Status report, ask Noesis to analyze the sprint, and review the suggested experiments. You walk into the retro with "here's what was actually slow, here's why, and here's what we could try next."
After a bad sprint — The report tells you exactly which stage caused the slip. Was it development taking longer than expected? Or was dev done on time but the PR ended up on a 3-day queue? The answer changes what you fix.
When you want to go deeper — You ask Noesis to analyze Tasks. It finds 82% waiting time — two items sat untouched for 5–9 days, while three started immediately. The bottleneck is selective, not systemic. Noesis suggests: commit to fewer tasks and track whether items stuck in ToDo for too long.
Over time — Open the report for the last few sprints manually. Is "In Review" always the top bottleneck? Or did it shift after you added a review SLA? This is how you track whether your process improvements are actually working.
One More Thing: What Not to Do
If you've read our article on 5 common mistakes when tracking time in status, you already know the pitfalls. But here's the short version for this context:
Don't use the data to blame people. "Your review took 3 days" is surveillance. "Our review stage averaged 2.8 days — what's causing the queue?" is process improvement. The framing matters.
Don't treat all statuses equally. A day in "In Progress" (active work) is fundamentally different from a day in "In Review" (wait time). Time in Status distinguishes between the two. Pay attention to the wait time — that's where the leverage is.
Don't measure without acting. Visibility is step one, not the finish line. If the report shows the same bottleneck three sprints in a row, it's time to change something. Use Noesis to figure out what.
